3M Pisa MSO Dashboard
Simplifying complex business metrics for collision shop owners

What is 3M Pisa?
3M Pisa is a digital tool that helps collision shops get reimbursed for repair materials, track inventory and repair orders by shop, and gain visibility to their shops to understand operational efficiency.
Collision Shops Using Pisa
Shop Owners with Multiple Shops
51
10
About the Project
The auto collision industry lacks high-quality, in-depth technology for owners with multi-shop operations (MSO). They rely on manual spreadsheets, and lack macro-views of key metrics across their organization.
Our goal was to build an aggregated dashboard for MSO owners to help them assess overall health of their shops.
This would address a key gap in the market, create a more competitive digital offering for 3M Pisa, and enhance 3M's product portfolio by delivering new value propositions to a distinct customer set.
How did 3M Pisa work for shop owners at the inception of this project?
The existing experience was clunky, ran on PowerBI, and did not account for more than one shop's data to be displayed at a time.

Starting with Research
The research team had conducted studies months before I entered as the design lead. The following information was given to me to guide design decisions.
Who is it for?
The target users for this dashboard are large shop owners and dealership directors.
What are the core user goals?
- Be aware of areas for correction within shops
- Better understand shop capacity to maximize number of jobs
- Be informed from a single source of truth to quickly assess overall business and shop health
- Hit financial goals for gross profit
- Run shops efficiently by maintaining relationships with vendors
Initial discovery work
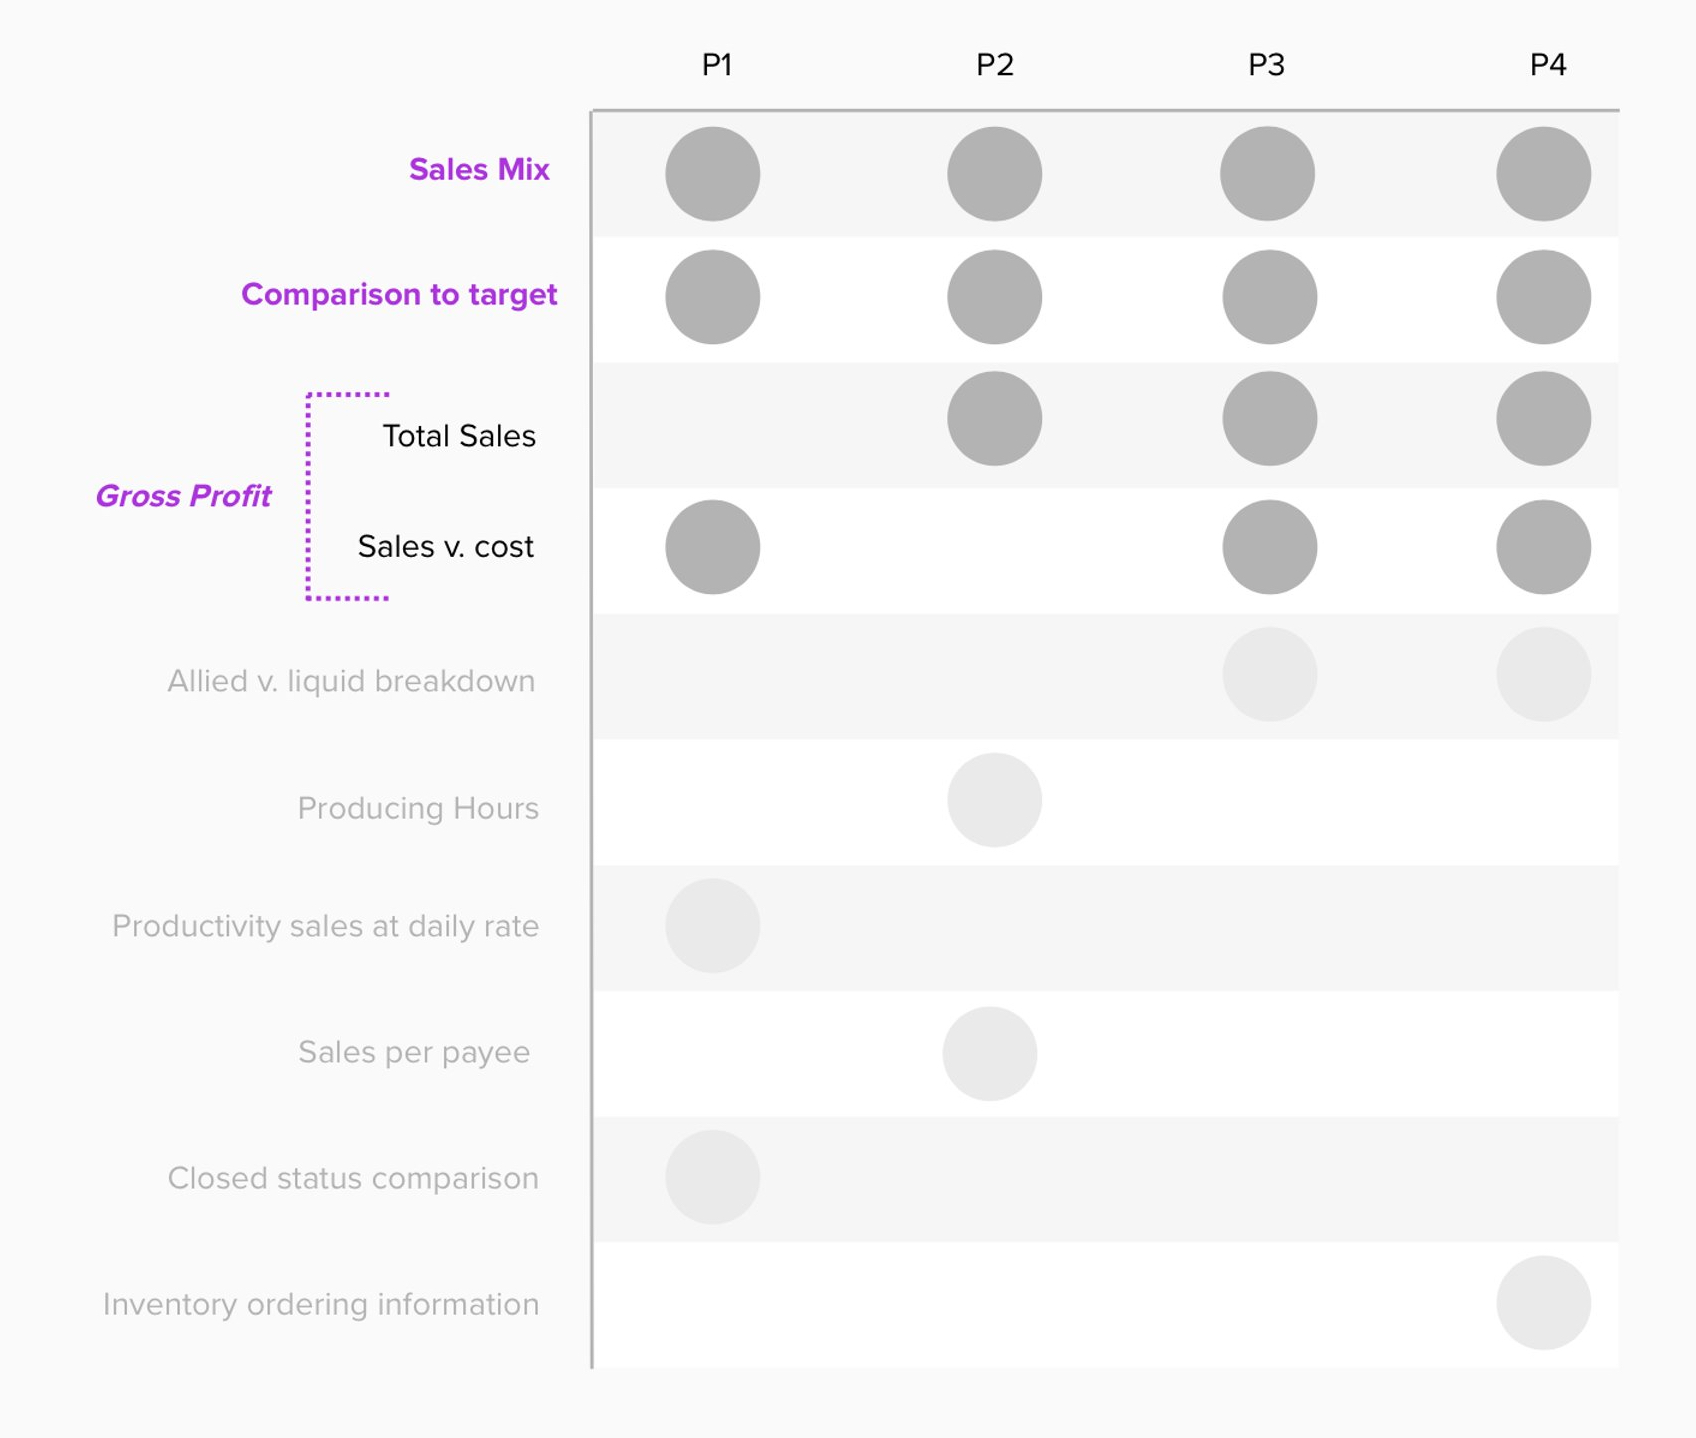
Our research team set up interviews with existing 3M Pisa customers to learn what data they need in an aggregate shop dashboard.
Across four separate sessions, a few trends started to emerge. Sales mix, gross profit, and learning how key metrics compare to targets were the most commonly requested data. These provided the most critical shop health data at the highest level.
Vision-Setting
To ensure alignment with stakeholders, I created a design brief including:
Primary goals...
- Design an easy-to-scan snapshot of key organization and shop metrics, prioritizing financials
- Highlight performance trends relative to targets
- Provide ingress points to explore individual shop financials
Success looks like...
- Increase in daily active users
- Fewer reports generated from 3M salespeople (who would send MSO owners custom reports) indicating favorable user interaction with MSO dashboard
- Increase in MSO customer conversion to 3M Pisa platform
- Increase in NPS score
Design principles...
- Clarity over complexity – prominently display high-level data over granular metrics
- Be consistent – use dependable patterns to build user confidence for repeatable success
- Accuracy first – provide most accurate, up-to-date data to enable trust in our platform
- Hands off – shop managers should not need to manually input data for analysis, integration streams should be utilized
Exploration
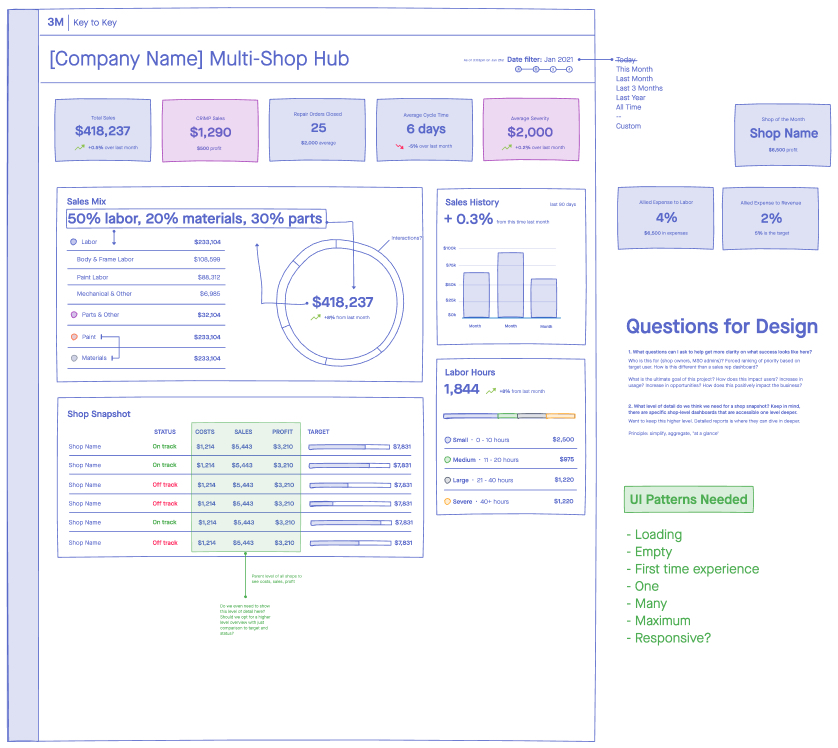
There were two rounds of concepting. I used Sketch with pre-defined UI styles and patterns to move quickly.
After this initial concept was designed, I reviewed with project stakeholders only to find out we weren't on the same page.
Although the data captured in the first iteration matched what design research had uncovered, the data points displayed did not match technical feasibility – and would be a new constraint for our MVP experience. This was a non-starter.
Note: This was a missed opportunity for me to disagree and commit. We had strong customer data and insight that would have influenced stakeholders to prioritize customers over speed to market.
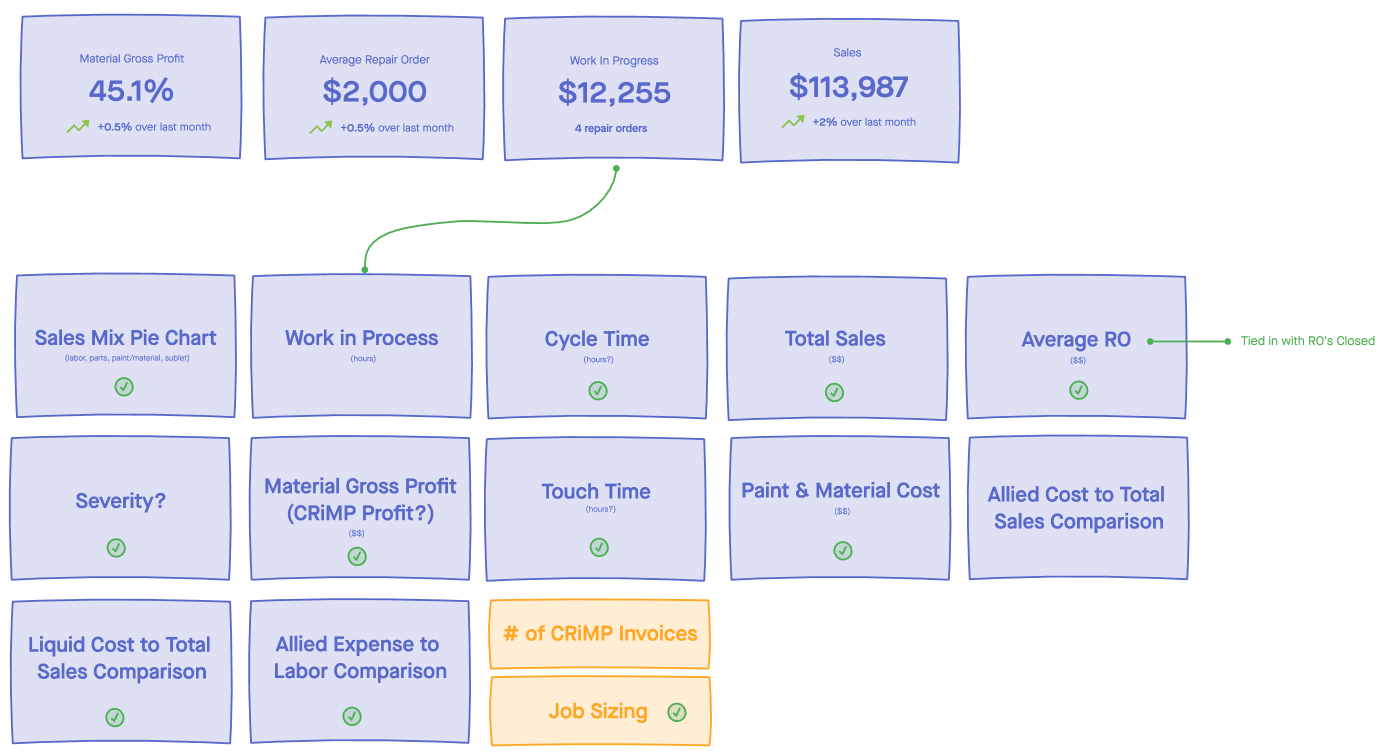
I connected with the product owner to limit scope to only use pre-existing data endpoints. I held real-time working sessions, listed all available data endpoints, and created potential layouts.

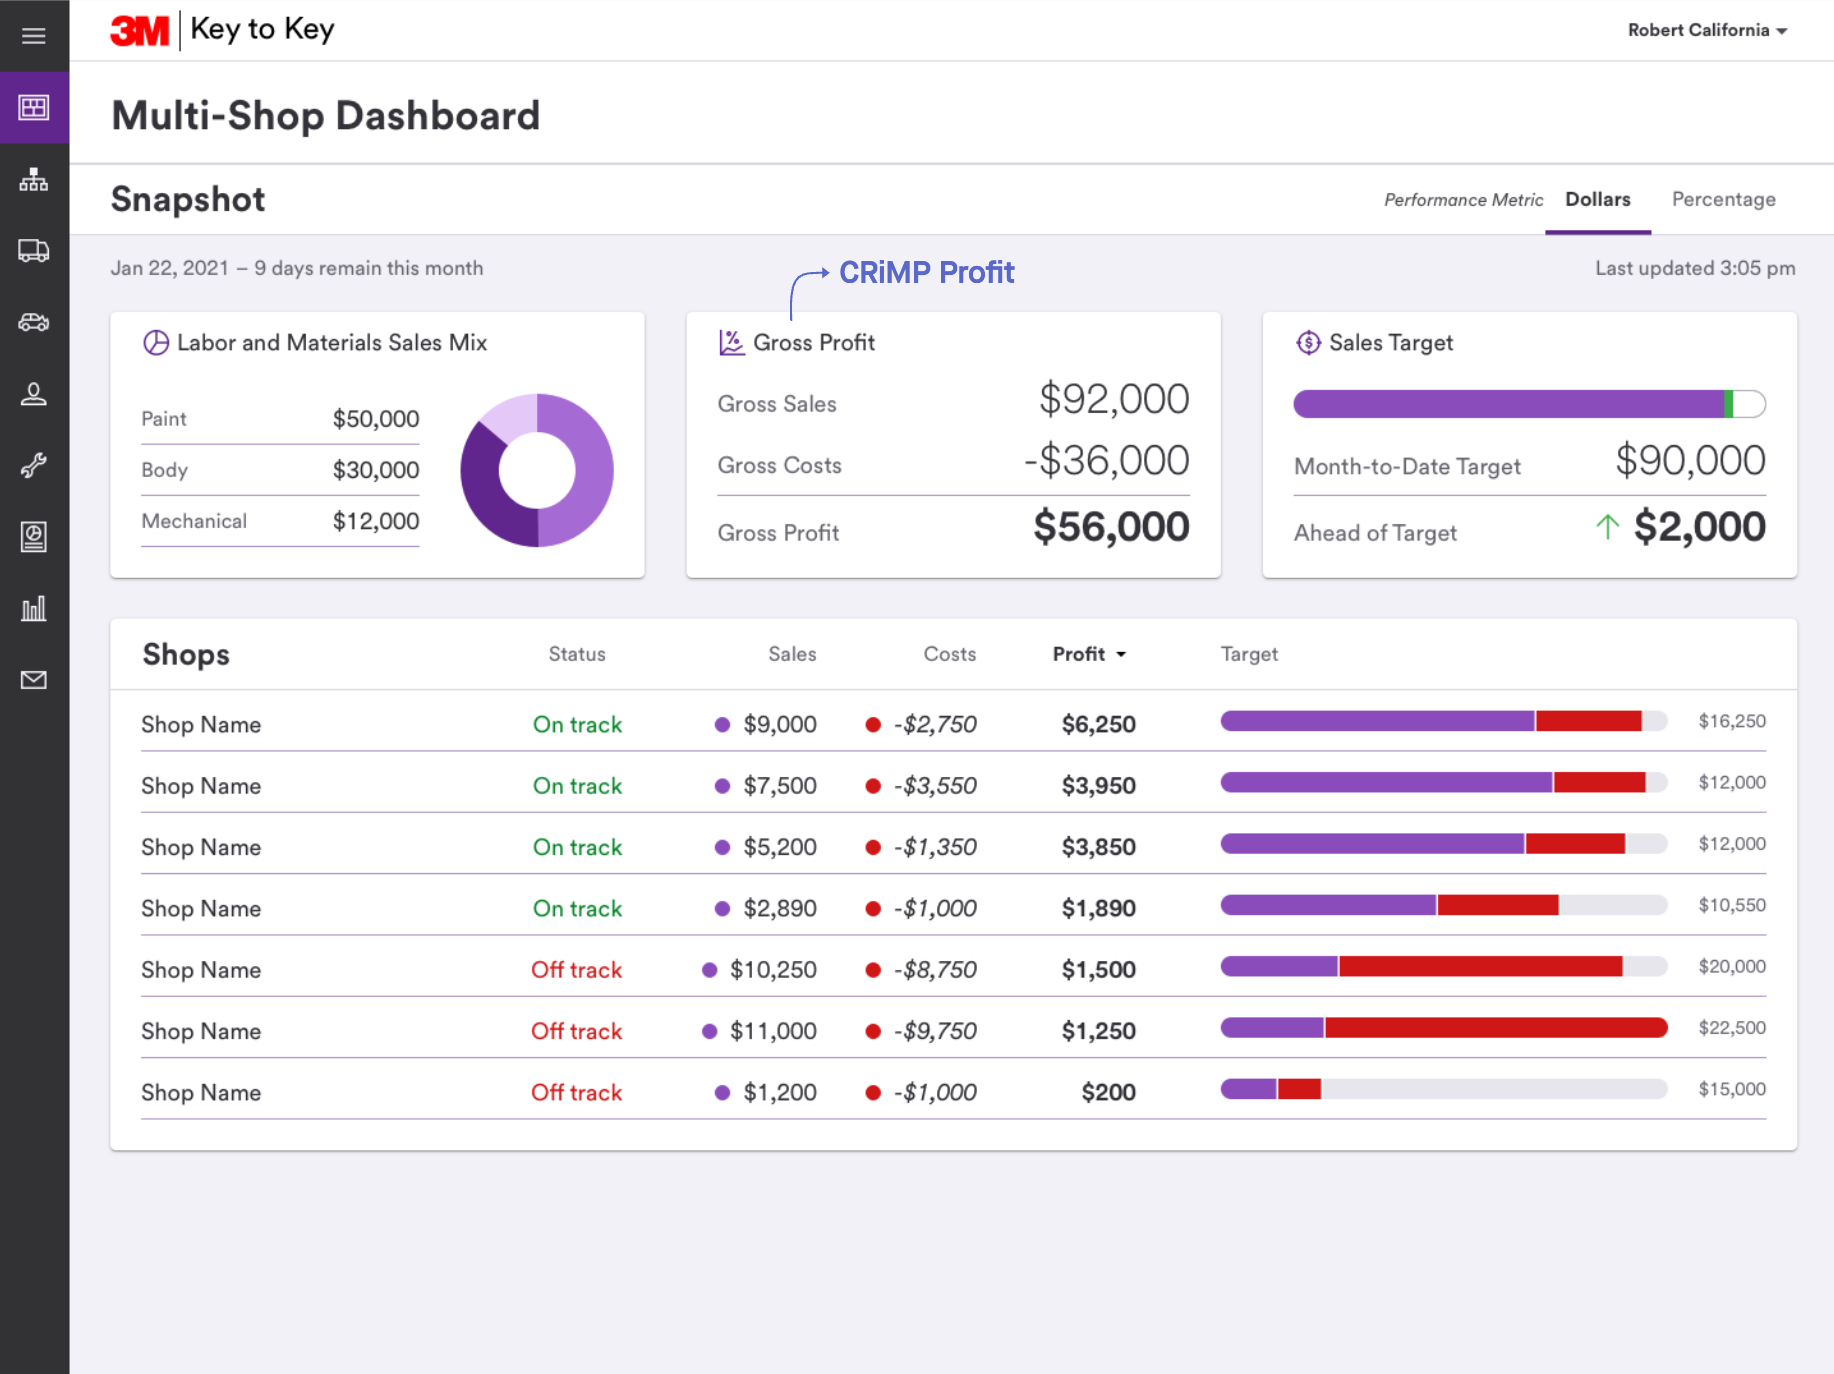
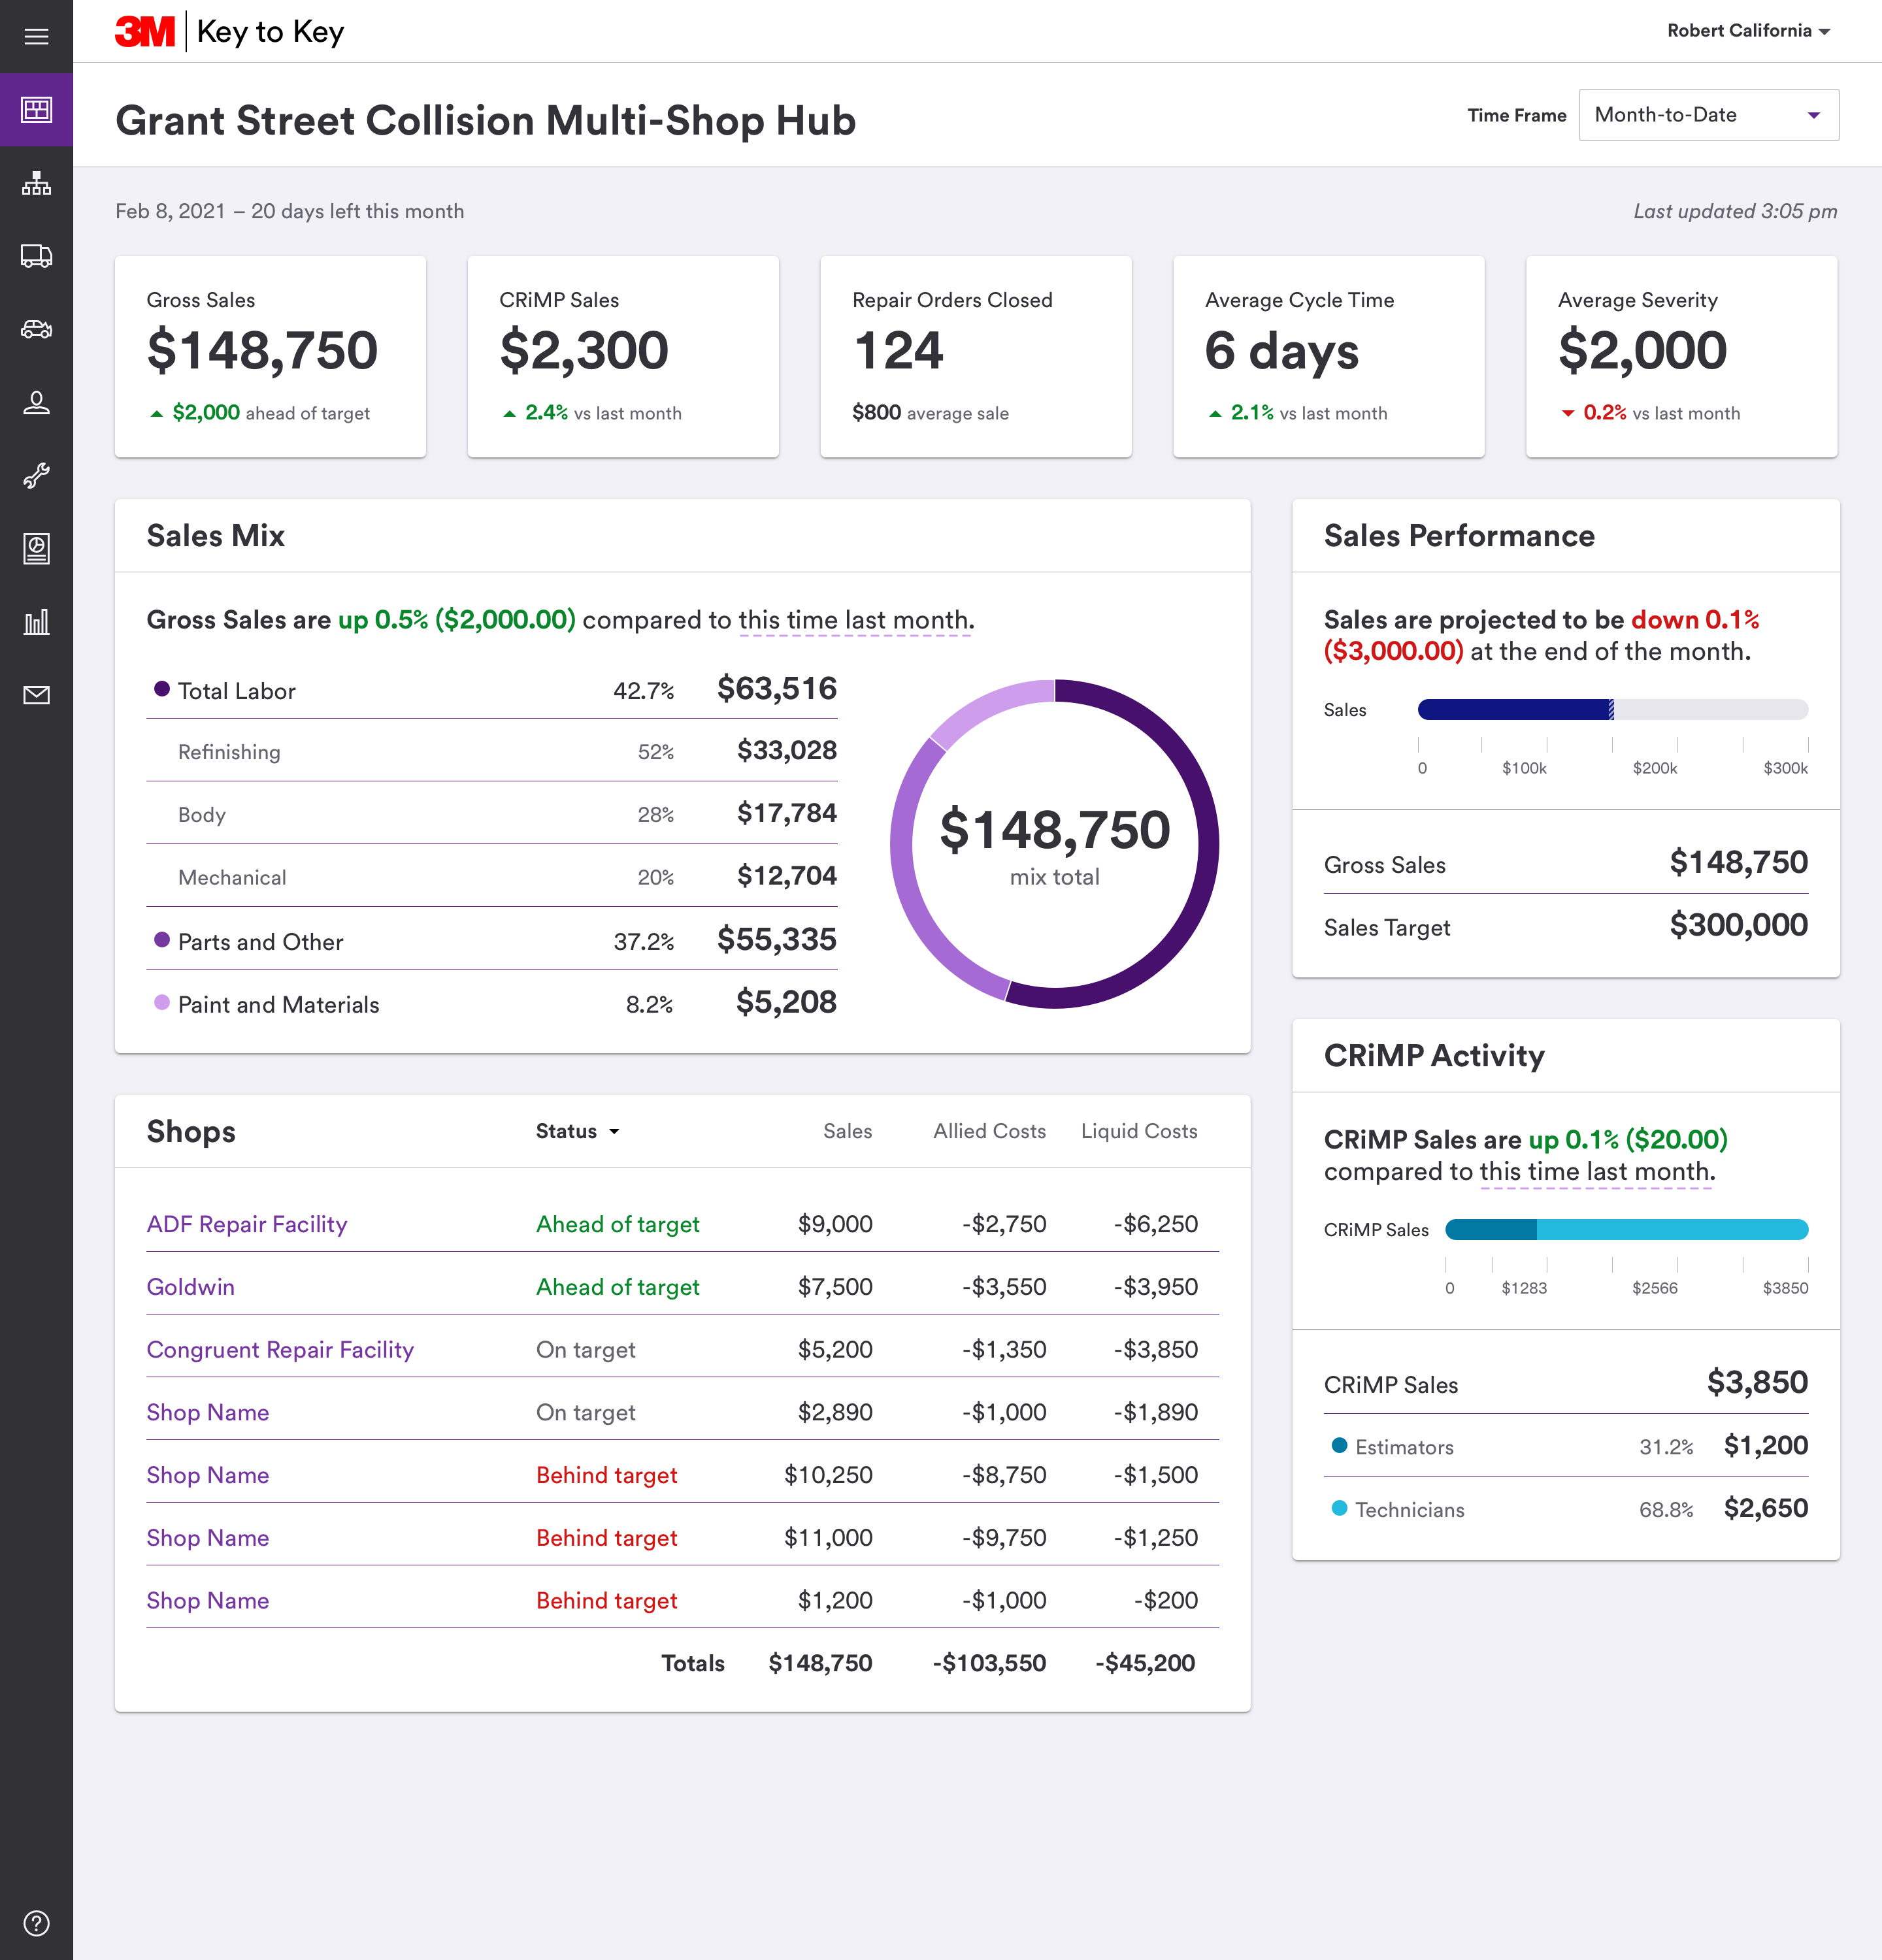
Applying the UI
I turned back to Sketch to apply visual polish.
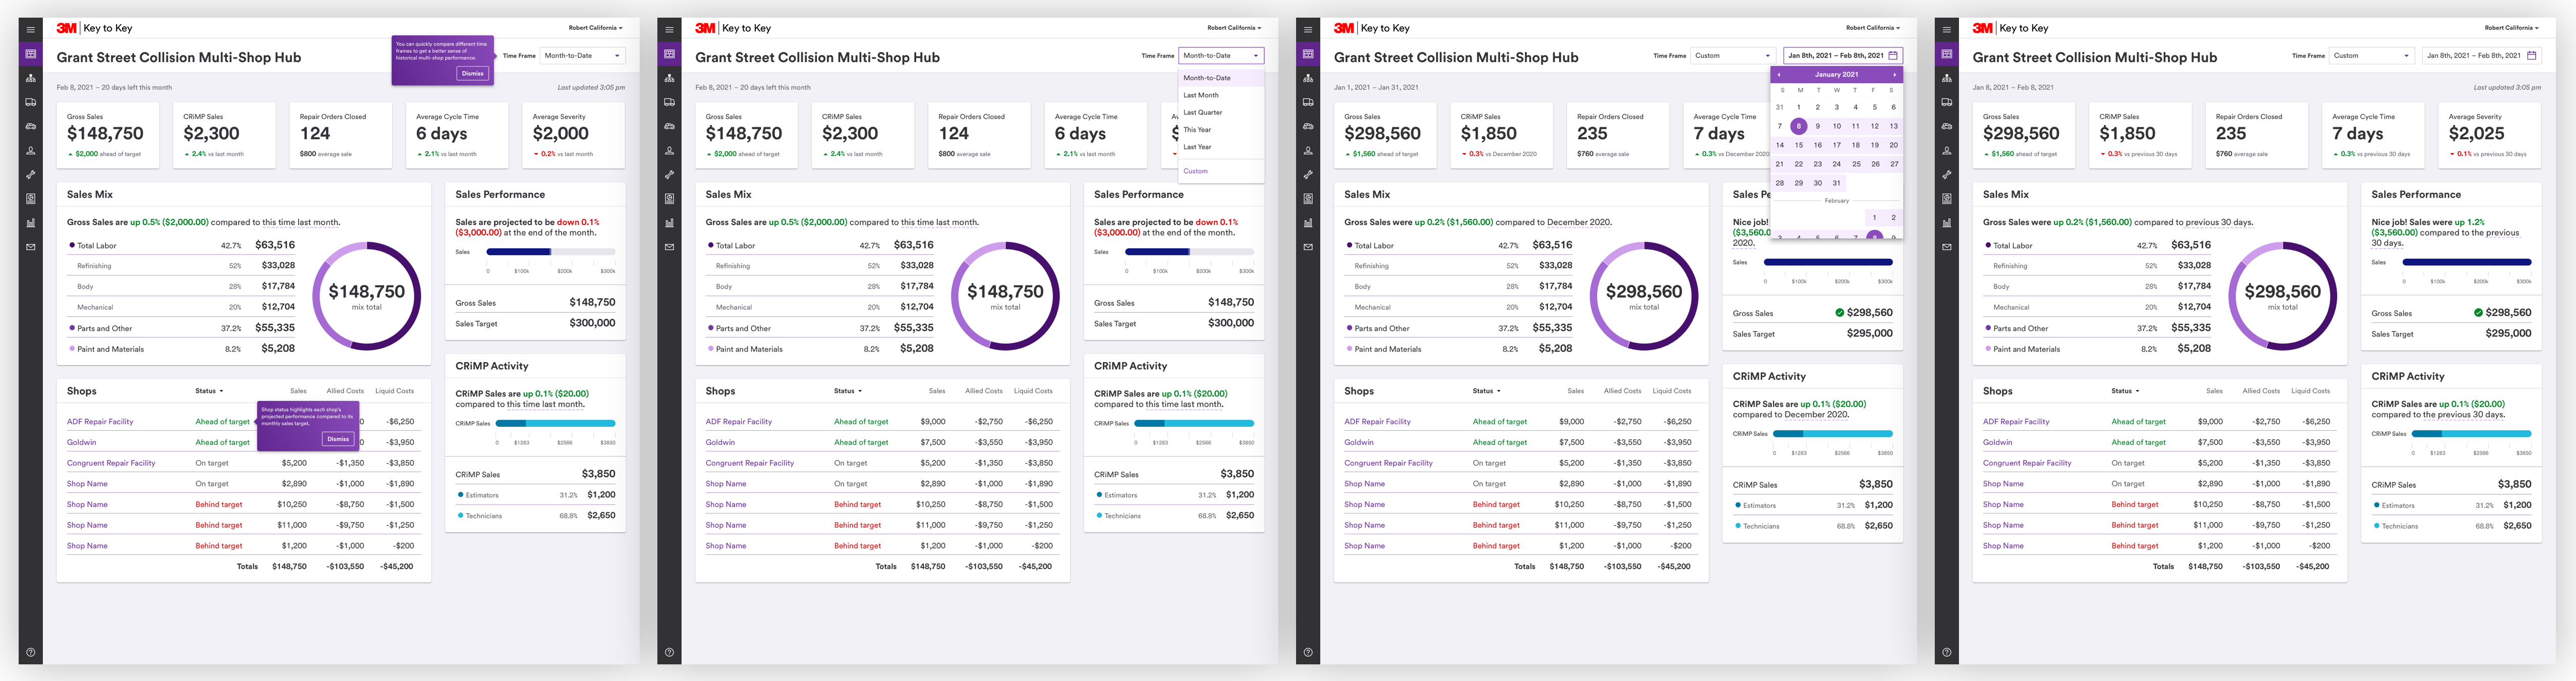
Prototype
A wise person once said, "A prototype is worth one thousand meetings". This simple prototype in InVision helped me share workflows and updates with stakeholders.
Outcome
I left 3M one month prior to this project's target launch. Due to cost-cutting initiatives, this product was sunset in late 2021.


